New paper in Clinical Cancer Research! The result of a joint work between Bergonié Institute, Gustave Roussy Institute and Explicyte.
Relying on precious patient samples and cutting-edge technologies, the teams involved discovered that Trophoblast cell-surface antigen 2 (TROP2), well-known as an attractive target for antibody-drug conjugate (ADC)-based therapy, is a strong predictor of resistance to immunotherapy, but not to chemotherapy, in patients with advanced lung cancer.
Pr. Antoine Italiano (Bergonié and Gustave Roussy Institutes) supervised the entire study, which follows on previous research on tertiary lymphoid structures (
more here). He shares his views on this outstanding work.
Read the article
here, entitled “
TROP2 is associated with primary resistance to immune checkpoint inhibition in patients with advanced non-small cell lung cancer”.
Why is TROP2 getting so much attention today?
Pr. Italiano: TROP2 emerges as a pivotal player in the realm of cancer research and therapy due to its overexpression in various cancer types (breast, lung, etc.). This high expression positions TROP2 as a promising biomarker for cancer detection but also as a prime target for therapeutic intervention.
The compelling narrative surrounding TROP2 is gaining further strength with the positive results of numerous studies evaluating the safety and efficacy of ADCs specifically designed to target TROP2. Tangible results have been achieved in breast, urothelial, and non-small cell lung cancer (NSCLC). These studies validate TROP2 targeting as a robust and successful strategy in the ongoing pursuit of effective cancer therapies.
In light of these substantial findings, TROP2 emerges as a beacon of hope and a focal point for future advances in cancer diagnosis and treatment.
What is the main result of your study? Can you comment on the link between TROP2 expression and the tumor microenvironment characteristics?
Pr. Italiano: The reason for the TROP2 upregulation in cancer cells remains unclear; however, it is postulated that TROP2 plays a crucial role in regulating cell proliferation and invasion. This suggests that its overexpression could selectively drive tumor progression. Notably, preclinical data support this hypothesis, demonstrating that TROP2 overexpression stimulates tumor growth, while TROP2 knockdown inhibits it.
Moreover, preclinical findings indicated that surface expression of TROP2 in lung cancer cells could impact the functionality of cancer cell reactive T cells, leading to apoptosis of CD8+ T cells. Intrigued by these observations, we sought to investigate the influence of TROP2 expression on treatment outcomes of NSCLC patients undergoing immunotherapy.
Our analysis of large independent patient cohorts revealed an association between TROP2 overexpression, NSCLC microenvironment, and response to immune checkpoint inhibitors. Specifically, NSCLC with low TROP2 expression had the highest abundance of immune cells, including T cells, cytotoxic lymphocytes, and B cells. Conversely, high expression of TROP2 was linked to primary resistance to immune checkpoint inhibitors. To our knowledge, this study represents the first correlation between TROP2 expression levels, tumor microenvironment, and patient outcomes.
What is the impact of this research on the clinical development of TROP2 ADC candidates?
Pr. Italiano: TROP2 targeting appears to be a very promising therapeutic strategy for patients with advanced NSCLC. Compelling results from the reference study (
TROPION-Lung01) Phase III trial show the effectiveness of the main TROP2 ADC (Datopotamab deruxtecan, Dato-DXd) compared to Docetaxel, the current standard of care in chemotherapy, in NSCLC patients treated with at least one prior line of therapy.
Recent data indicate that combining TROP2 targeting with PD-1/PD-L1 inhibition yields promising responses and presents no new safety signals in patients with previously untreated advanced or metastatic NSCLC lacking actionable genomic alterations.
Building on our results, we hypothesize that patients most likely to benefit from this therapeutic strategy are those with high TROP2 expression. Notably, our finding of a strong correlation between circulating levels of TROP2 and its expression by tumor cells suggests that selection of these patients can be achieved non-invasively through a simple blood test.
This groundbreaking approach not only strengthens the potential of TROP2 as a key therapeutic target, but also introduces a practical and accessible method of patient stratification, paving the way for personalized and effective treatments at the forefront of NSCLC management.
How did Explicyte contribute to this major discovery?
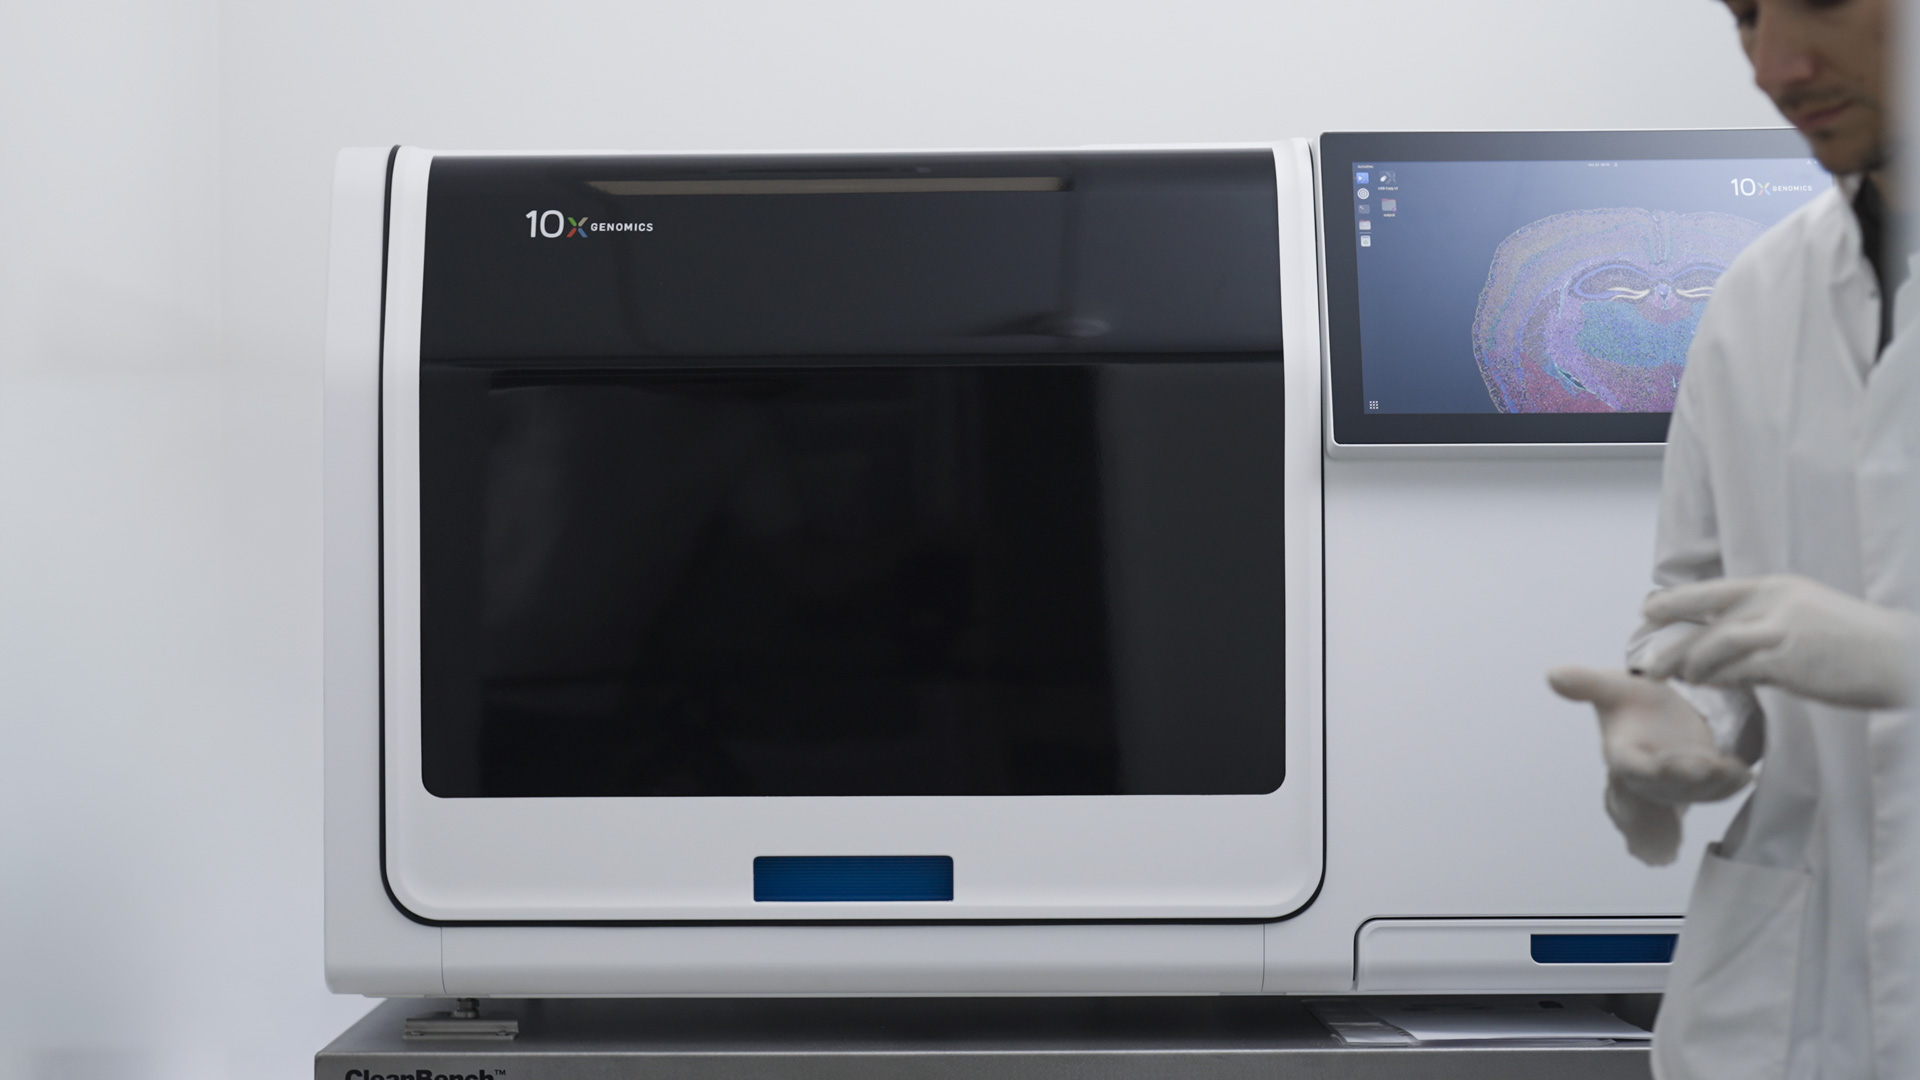
Pr. Italiano: The collaboration with Explicyte teams played a pivotal role in the success of this study. Explicyte offers a unique and comprehensive immuno-oncology platform, seamlessly integrating robust analytical technologies, for groundbreaking testing of cancer immunotherapies. This includes cutting-edge capabilities in gene sequencing, spatial transcriptomics, multiplex immunofluorescence, plasma proteomics, and more.
Explicyte being installed within Bergonié Institute, this proximity allows our clinical and research teams to foster close collaborations with them. Undeniably, this proximity favors a synergistic approach to advance our understanding of cancer immunotherapies and translate these findings into meaningful clinical applications. The invaluable contributions offered by these collaborative efforts underscore the strength of our partnership in driving innovative advances in the field of immuno-oncology.
What are the remaining challenges to radically change the outcome of NSCLC?
Pr. Italiano: NSCLC poses a myriad of challenges due to its heterogeneous nature. A significant breakthrough lies in the development and validation of a platinum-free first-line regimen for patients with advanced NSCLC, free of adverse effects.
Our results present a compelling proposition in this regard. Combining TROP2 ADC with immune checkpoint inhibitors emerges as a promising strategy, while introducing a paradigm shift in how we approach the treatment of advanced NSCLC. To the extent that it eliminates platinum from the therapeutic landscape, it holds the promise of significantly improving the quality of life of patients facing this complex and demanding disease.

