Development and characterization of a novel anti-PD1 resistant sarcoma mouse model
Soft Tissue Sarcoma (STS) is known to be refractory to current cancer immunotherapies including the PD1 immune checkpoint inhibitor (ICI) (Toulmonde et al., 2018), thus claiming the development of novel therapeutic strategies aiming at improving the current clinical benefit.
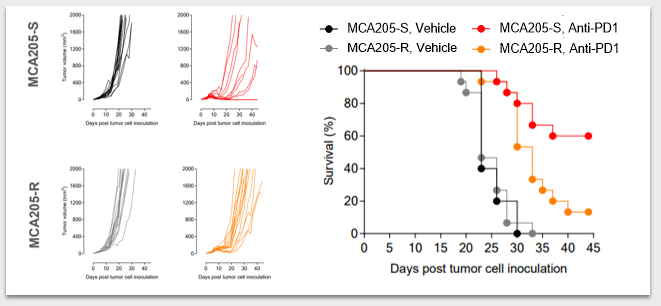
In order to evaluate innovative treatment regimens, such as new combination therapies, or tackling novel immuno-suppressive axes, we developed and characterized a sarcoma preclinical model resistant to anti-PD1. As illustrated below through individual tumor growth monitoring and survival analysis (Fig. 1), while MCA205-S (Sensitive) is responsive to PD1 blockade, ie. tumor growth delay and full tumor rejection in some mice, anti-PD1 treated MCA205-R (Resistant) bearing mice did not experience full tumor shrinkage and rejection.
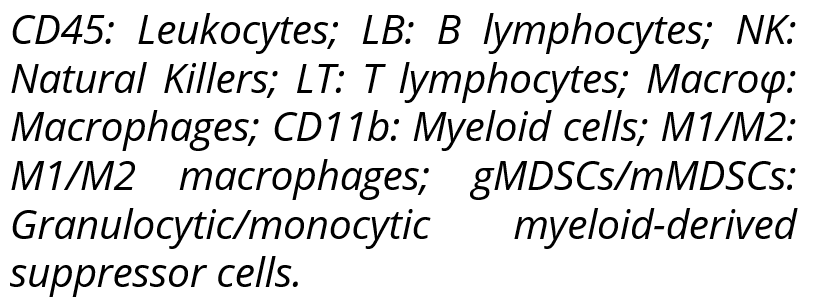
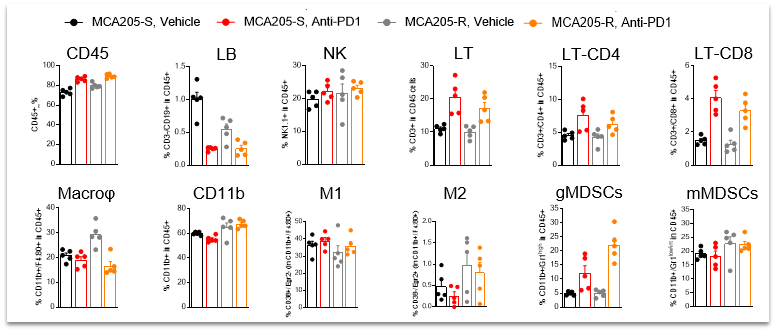
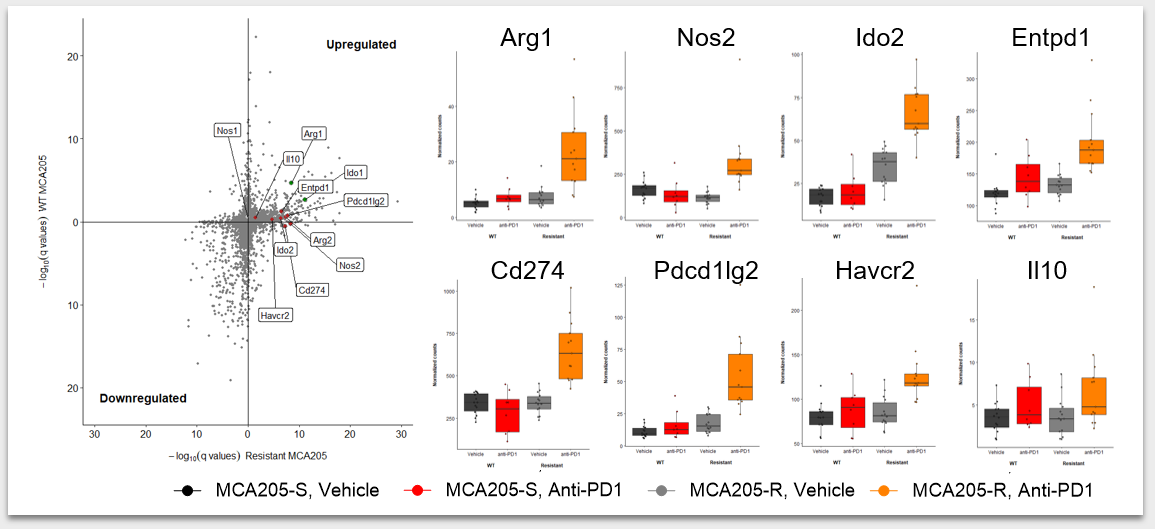
In order to understand mechanisms underlying resistance to ICI, we analyzed in depth the tumor immune infiltrates using a flow cytometry-based approach (Fig. 2), which notably revealed a greater abundance of macrophages (CD11b+ / F4:80+) in MCA205-R than in MCA205-S tumors. Furthermore, we characterized the gene expression profile of tumor biopsies through RNA-sequencing (Fig. 3) and highlighted key genes significantly up-regulated upon anti-PD1 treatment in MCA205-R tumors, including Ido2, Arg2, Pdl2, Pdl1, Havcr2 (coding for Tim3), Entpd1 (coding for CD39).
Our unique resistant model can thus serve to evaluate novel immunotherapeutic regimens either alone or in combination with reference ICIs, to ultimately translate into clinical benefit for STS patients treated with immunotherapy.


