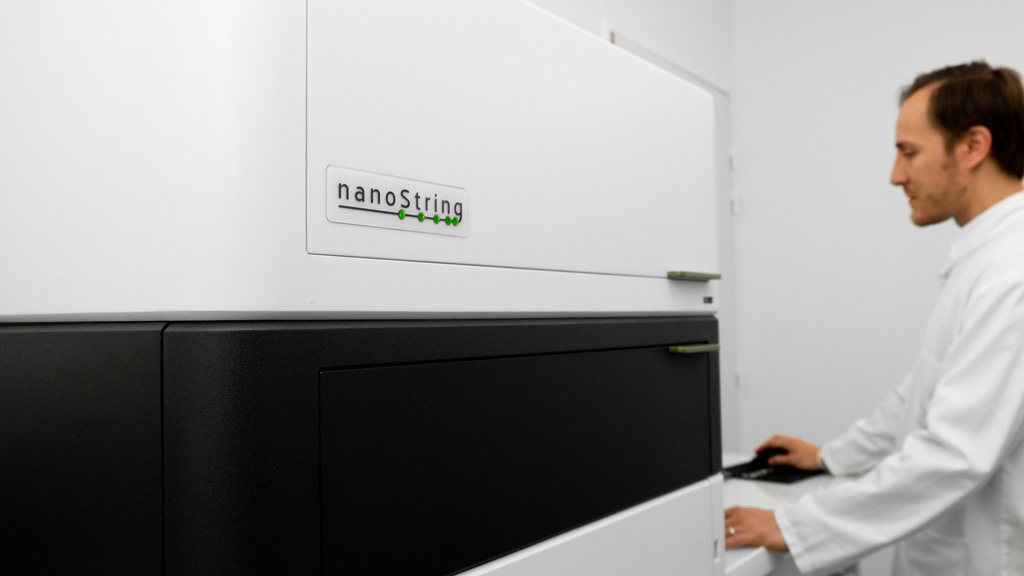
It is primordial to benefit from a technological platform that allows to deal with the tumor biology complexity/heterogeneity and get specific investigations in compartments of interest (e.g. tumor vs stroma). Thanks to the GeoMx platform (Nanostring Inc.), which combines the spatial resolution of immunohistofluorescence with the high-plex gene/protein expression analysis, the Digital Spatial Profiling (DSP) revolution has started.
Starting from specimens as simple as FFPE tissue samples, this novel technology offers through selected panels the simultaneous analysis of up to 96 mRNAs or 10’s-100’s proteins in several regions of interest (ROIs) divided in two compartments. In addition to these panels, the new comprehensive Cancer Transcriptome Atlas (CTA) covering 1,800 genes and more than 50 cancer-related pathways is now running!
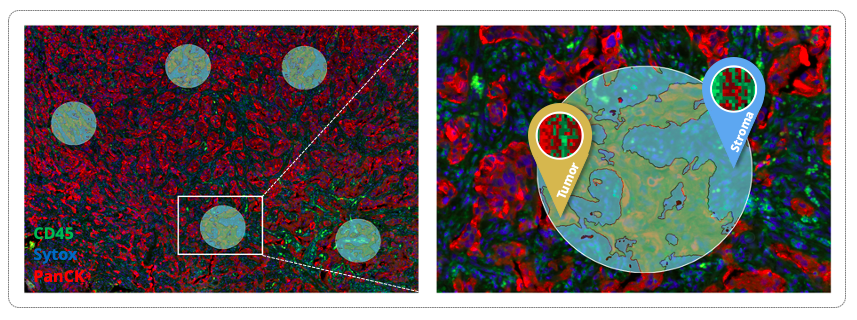
Figure 1. FFPE tissue section from human lung cancer was stained for standard fluorescent morphology markers (i.e. PanCK in red, CD45 in green) and nuclei counterstained with Sytox as to allow tissue segmentation. Concomitantly with the morphology markers, oligo-tagged ISH probes (RNA) targeting 1,800 genes from the CTA were applied. ROIs were then selected and segmented into stroma and tumor areas thanks to the morphology markers. Oligos were cleaved and released from selected areas (Areas of Illumination, AOIs) via UV exposure, and then collected via a microcapillary tube and processed for library preparation and next generation sequencing.
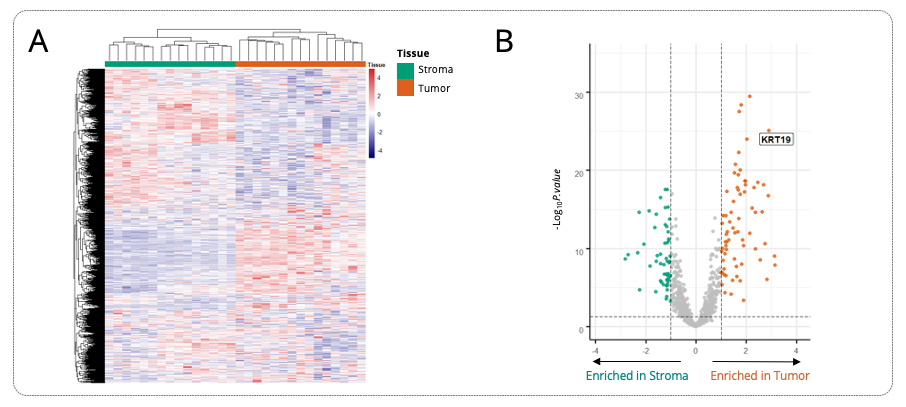
Figure 2. (A) Heatmap view of the unsupervised clustering of 15 ROIs (divided in 15 AOIs in stroma and 15 AOIs in tumor) according to the 1,800 genes expression profile. In the heatmap, the Y-axis represents the 1,800 genes and the X-axis represents the AOIs. The expression levels from low to high are represented as a color gradient from blue to red, respectively. (B) Volcano plot representation of differential gene expression between stroma and tumor areas collected from the different ROIs. Vertical dotted lines represent ± Log2(FC>2) while the horizontal dotted line indicates a p-value of 0.05. Highlighted genes depicted on the volcano plot are the significantly enriched ones in the stroma (left part, green) and tumor compartment (right part, orange).
Learn more about our capacities & services in spatial transcriptomics