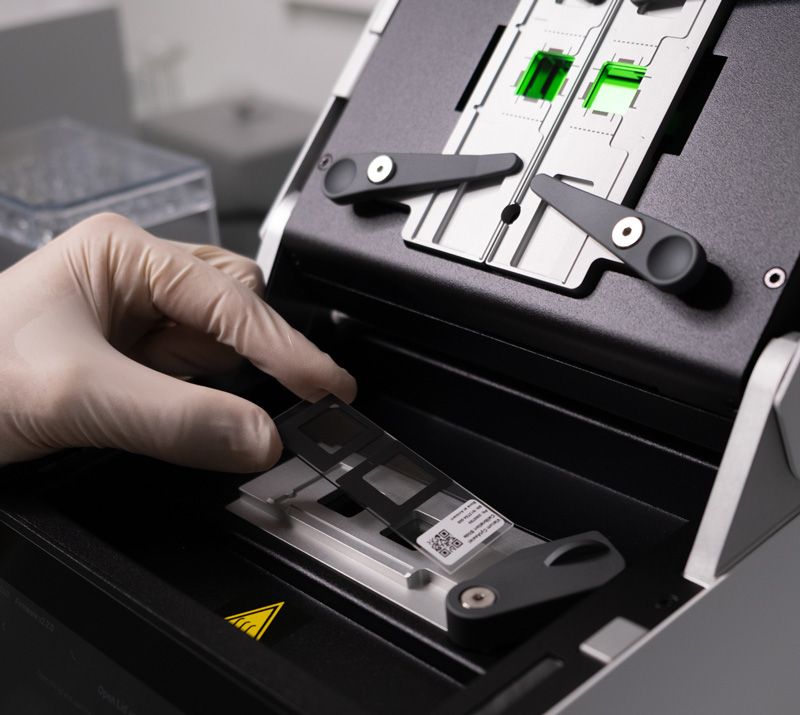
#1 Processing specimens for spatial transcriptomics
- Eligible tissues (human or rodent): fresh, frozen or FFPE tumor specimens (core needle biopsies, Tissue Microarrays, surgical sections) and organoids
- On-site capacities : fixation, paraffin-embedding, slicing
- Sample qualification: quality assessment prior to experiments to ensure reliable results

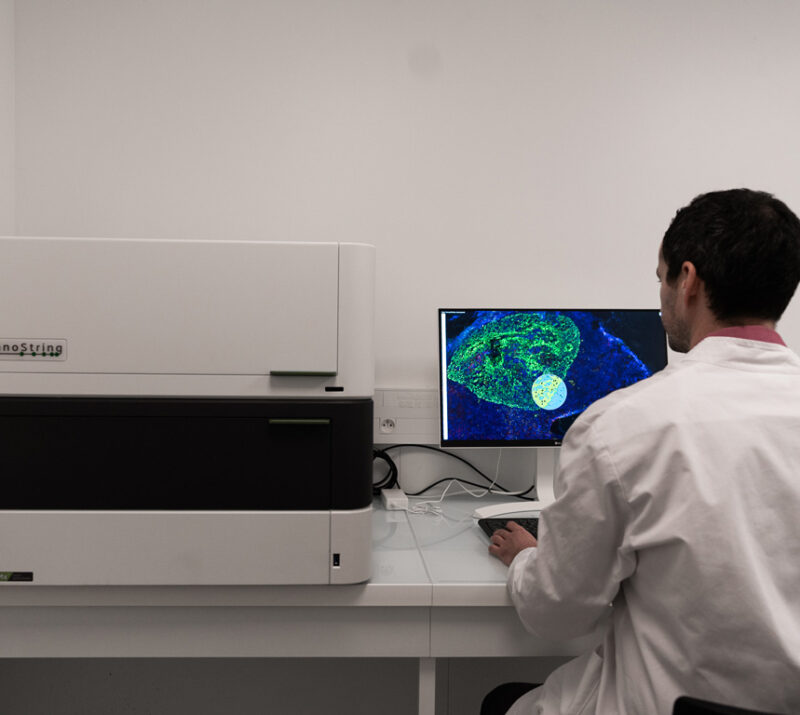
#2 Choosing the right spatial transcriptomics platform
- GeoMx by Nanostring: digital spatial profiling in specific regions of interest, with an exhaustive probe panel (Whole Transcriptome Altlas, 18k protein-coding genes)
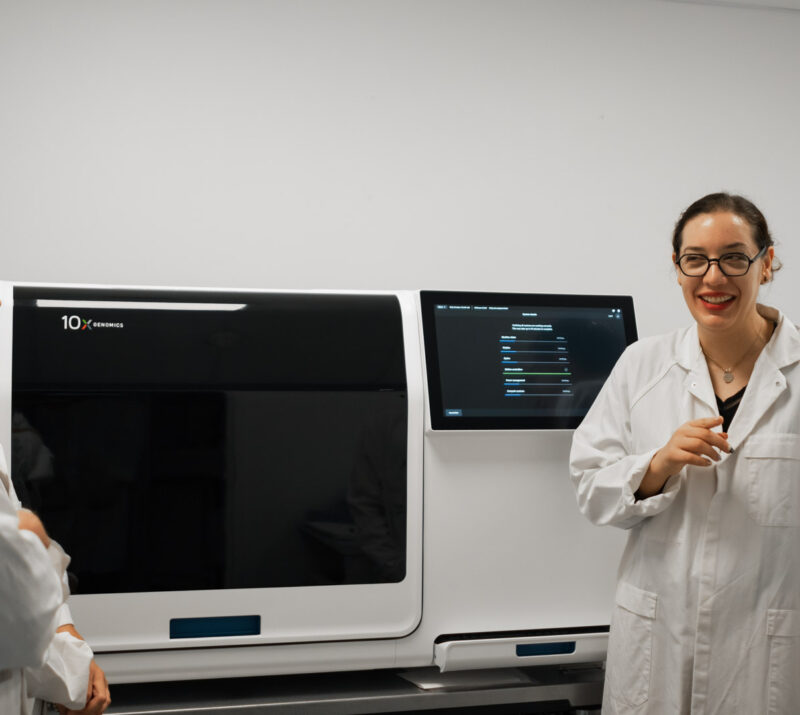
- Xenium by 10x: spatial transcriptomics at single-level to understand the expression profile of each cell in the samples (probe set up to 5K)
- Visium HD by 10x: whole-transcriptome spatial analysis with 2 μm x 2 μm resolution (single-cell scale)
#3 Custom data analysis, mapping & representation
- Gene expression mapping & image analysis: target identification in specific compartments or cell populations (tumor, immune cells, …)
- Differential gene expression: production of heatmaps and volcano plots
- In-depth statistical analysis: exploration of signaling pathways, gene signatures, spatial heterogeneity


Experts
in Immuno-Oncology
- 30+ papers released over the past 5 years in the field of immuno-oncology with a focus on translational studies
- 10-year experience >10,000 samples processed to explore the mechanisms associated with sensitivity to cancer therapies
- Comprehensive translational platform to confirm insights from spatial transcriptomics through digital pathology and explore peripheral markers (single-cell RNASeq, proteomics, flow cytometry, …)
Personalized
approach
- Custom experimental design sampling and panel strategy adjusted to your needs and samples
- A dedicated study director (PhD) to tailor the experimental plan to your need and discuss results
- In-house data science team to make the most of your spatial transcriptomic dataset


Your contacts

Talk to our team !
Paul Marteau, PharmD (preclinical study director), Imane Nafia, PhD (CSO), Loïc Cerf, MSc (COO), Alban Bessede, PhD (founder, CEO), Jean-Philippe Guégan, PhD (CTO)
Tell us about your project !
Spatial transcriptomics CRO services I Immuno-Oncology I Cancer Immunotherapy Targets & Biomarkers
Explicyte Immuno-Oncology is a translational CRO with specific capacities in spatial transcriptomics. Over the past years, the company released over 15 papers based on spatial transcriptomic data generated with the GeoMx digital spatial profiling (DSP) platform by Nanostring. In 2024, Explicyte acquired the Xenium platform by 10x in order to provide single-cell spatial transcriptomics services for the discovery and validation of novel cancer immunotherapy targets and biomarkers, and the characterization of the anti-tumor immune response to novel drug candidates.