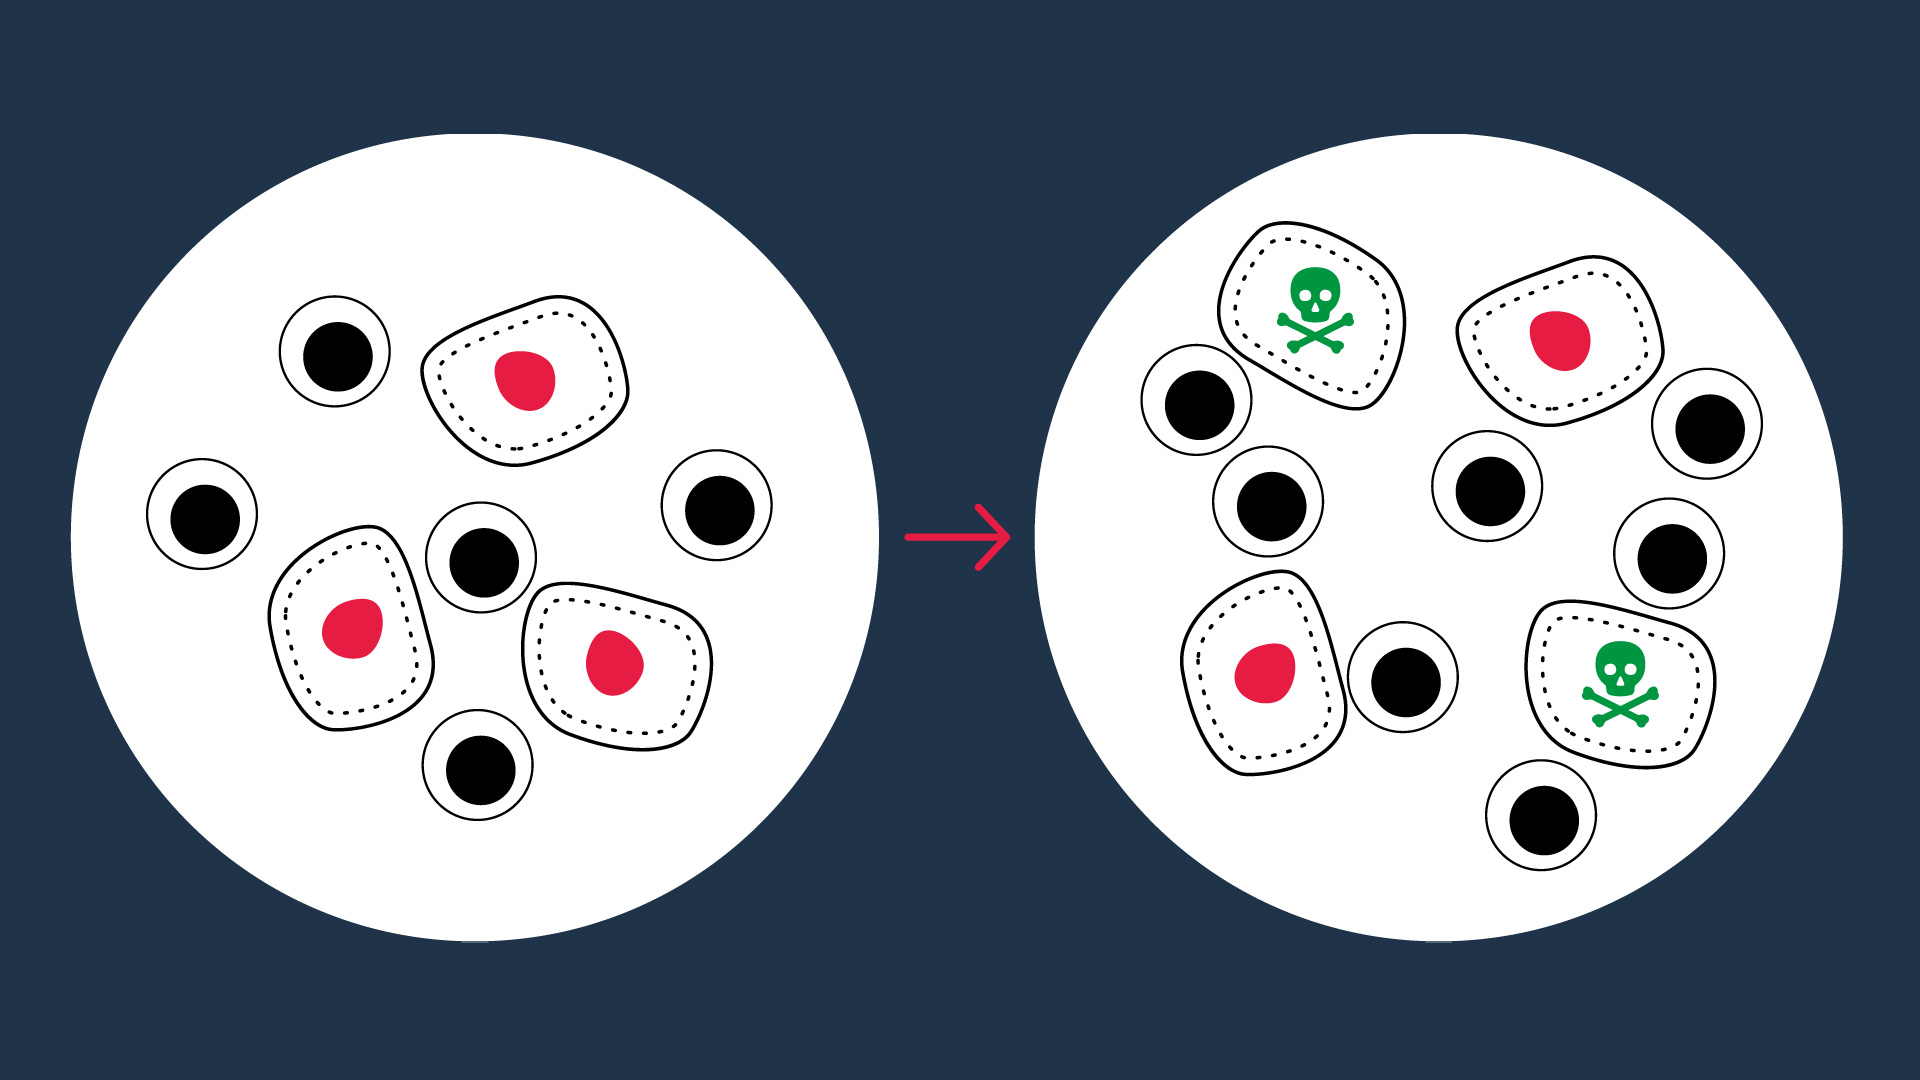
Initiation of an anti-tumor immune response and further cancer cell elimination is a key step in cancer immunosurveillance. One of the current promising challenges in cancer immunotherapy is the potentiation of the specific attack of tumor cells by the immune system. Interestingly, in vitro immune cell killing is recognized as perhaps the most relevant functional measure to evaluate the ability of a candidate compound to promote such an effector function of immune cells.
We designed a specialized in vitro immune cell killing assay to assess your immunomodulatory candidate compounds/antibodies for their ability to enhance the killing immune response towards tumor cells. By using live cell imaging platform, our sensitive and quantitative assay based on 96-well plate co-culture of human tumor cells (e.g. MDA-MB-231 breast, SKOV-3 ovarian, A549 or H1299 lung cancer cells…) and primary peripheral blood mononuclear cells (PBMCs) enables the kinetic monitoring and analysis of cell deathspecifically within the tumor cell population. Analyzed data can then be represented in kinetics or integrated as AUC within an indicated time window or at specific endpoints.
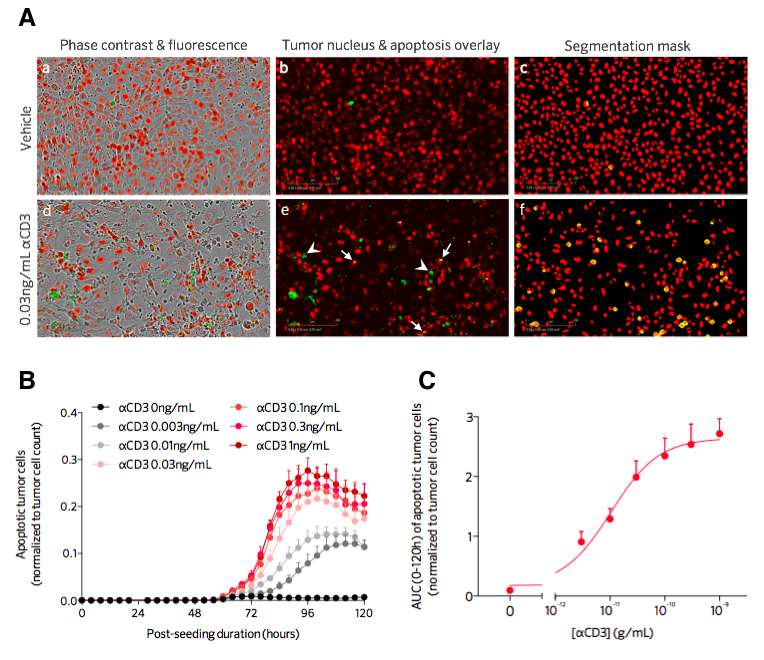
Immune cell-mediated killing of H1299 lung cancer cells in the presence of various concentrations of aCD3. H1299 tumor cells stably expressing a nuclear red fluorescent probe are cultured, at an appropriate effector:target ratio, with inactivated or aCD3-activated hPBMC. A. aCD3 induces hPBMC-mediated apoptotic killing of target tumor cells. Live cell real time detection images of apoptotic H1299 tumor cells at 72h post-culture with inactivated and aCD3-activated hPBMC. Tumor cell count (nuclear red probe-expressing cells, (a, b, d, e)) and apoptosis (i. e caspase 3/7 green fluorescent probe, (a, b, d, e)) are kinetically monitored by live cell imaging. Segmentation masks & image analysis are performed (c, f) to quantify apoptosis specifically within the tumor cell population (i.e. caspase 3/7 green fluorescent probe within the nuclear red probe-expressing cells – yellow objects). Arrows on the image e indicate apoptotic tumor cells and arrowheads apoptotic non-tumor cells. B. Kinetic and dose-dependent effect of aCD3 in inducing hPBMC-mediated apoptotic killing of H1299 cancer cells. Tumor cell apoptosis is quantified and results are then normalized to tumor cell count and plotted overtime on a 120h post-treatment period. C. Dose-dependent effect of aCD3 in inducing hPBMC-mediated apoptotic killing of H1299 cancer cells. Tumor cell apoptosis is quantified and results are then normalized to tumor cell count and expressed as integrated AUC values over 120h post-treatment.


