
10 years of experience testing novel anti-cancer immunotherapies
- New chemical entities (NCEs)
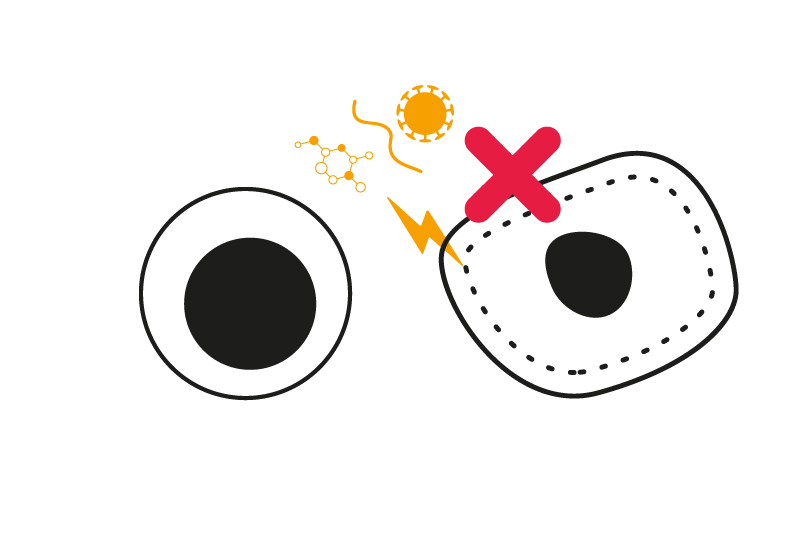
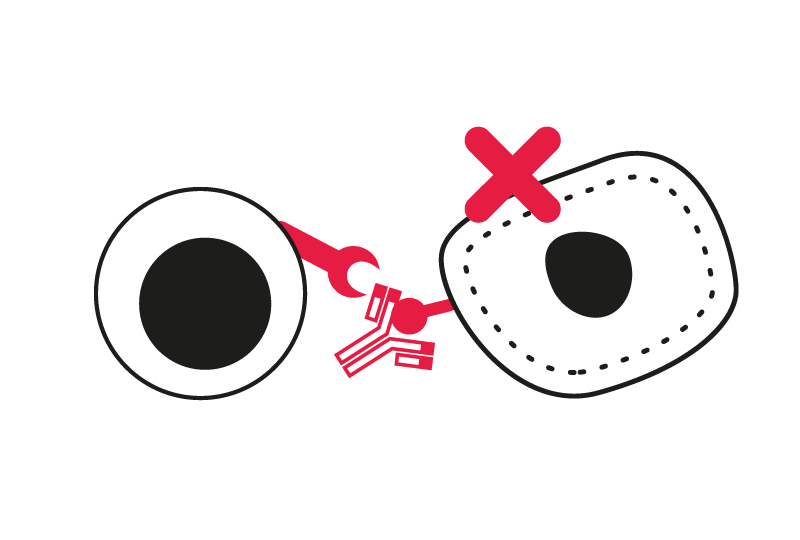
- Biologics: immune checkpoint inhibitors, bispecific T-cell engagers, ADCs
- Cancer vaccines: Gene & RNA therapies, oncolytic viruses
- Cell therapies: CAR-Ts, NKs

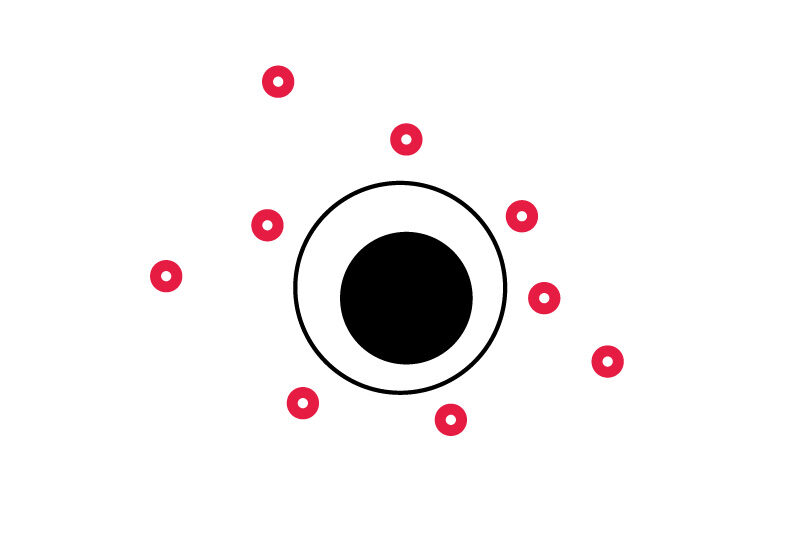
Custom human in vitro tumor models to assess immune response
- >Over 100 cancer cell lines to model any malignancy, including tumors that are non-responsive to standard immunotherapies
- Co-cultures with primary immune cells to recapitulate the immunological synapse (Ts, NKs, macrophages, dendritic cells, etc.)

A flexible platform for screening & mechanism of action studies
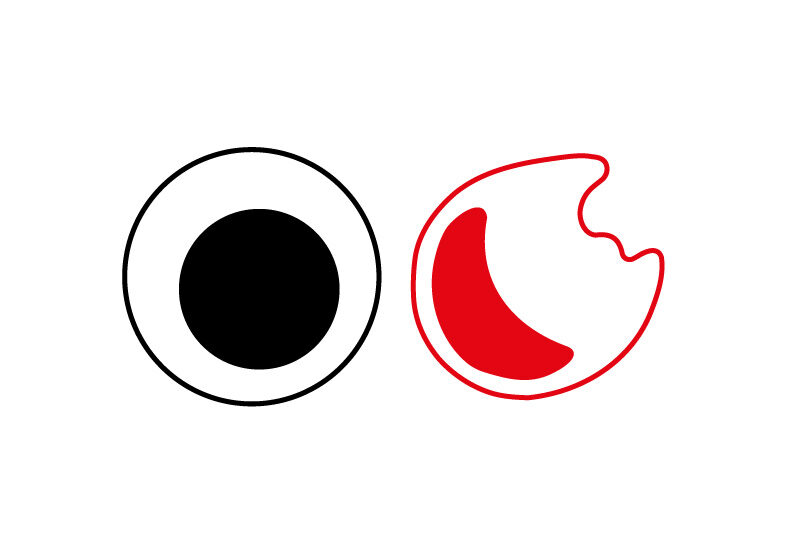
- Live cell imaging to track immune cell activation, expansion & tumor-killing activity
- Flow cytometry for multiplexed immuno-phenotyping
- Cytokine analysis, proteomics, and transcriptomics to document immune response


Why working with Explicyte?
Experts
in Immuno-Oncology
- 100+ in vitro campaigns conducted over the past 10 years
- 30+ peer-reviewed publications in key immuno-oncology journals
Personalized
approach
- Targeted discussion based on request to design bespoke strategy & fit-for-purpose study proposal
- A dedicated study director (PhD level) from experimental plan to final report discussion
- Custom assays: cellular model, readouts & reference treatment defined with the sponsor


Your contacts

Talk to our team !
Paul Marteau, PharmD (preclinical study director), Imane Nafia, PhD (CSO), Loïc Cerf, MSc (COO), Alban Bessede, PhD (founder, CEO), Jean-Philippe Guégan, PhD (CTO)
Tell us about your project !
Cell-based Assays for Immuno-Oncology I in vitro CRO Services I Cancer ImmunoTherapy screening
Explicyte immuno-oncology is a preclinical CRO providing research services for the in vitro screening of novel cancer immunotherapies, including small molecules, monoclonal antibodies, BiTEs, ADCs, CAR-T cell therapies, and Natural Killer (NK) cell therapies. Our in vitro cancer models, co-cultured with immune cells, can be treated with immune checkpoint inhibitors, such as anti-PD-1/PDL-1 and CTLA-4 antibodies, for combinatorial strategies. Besides functional cellular assays to test the efficacy of anti-cancer immunotherapies, Explicyte offers a range of dedicated immuno-oncology assays for mechanism of action studies (MoA), such as cytokine release assays, immuno-phenotyping by FACS, and transcriptomic studies (RT-qPCR). Cancer immunotherapy strategies can be divided in three main categories including cytokines and immunomodulatory agents, antibody-based, and cell-based therapies. Explicyte’s expertise and advanced technologies have been harnessed so as to develop and build a cell-based service portfolio for immuno-oncology drug discovery. Our in vitro models & assays are sensitive, quantitative, and high throughput-compatible, thereby allowing to characterize and understand test compound’s effects, and identify single immunotherapeutic candidates or combination strategies that elicit immune cell functions and/or tumor cell sensitivity.