A variety of eligible samples
- Diverse origins: we work with samples originating from both clinical and preclinical studies (see our in vivo platform).
- Sample types: tissue samples (FFPE, cryosections) and biological fluids (PBMCs, plasma).
- Custom sourcing of human samples: through partnerships with accredited French biobanks, we can access human tumor samples
Validated and custom panels
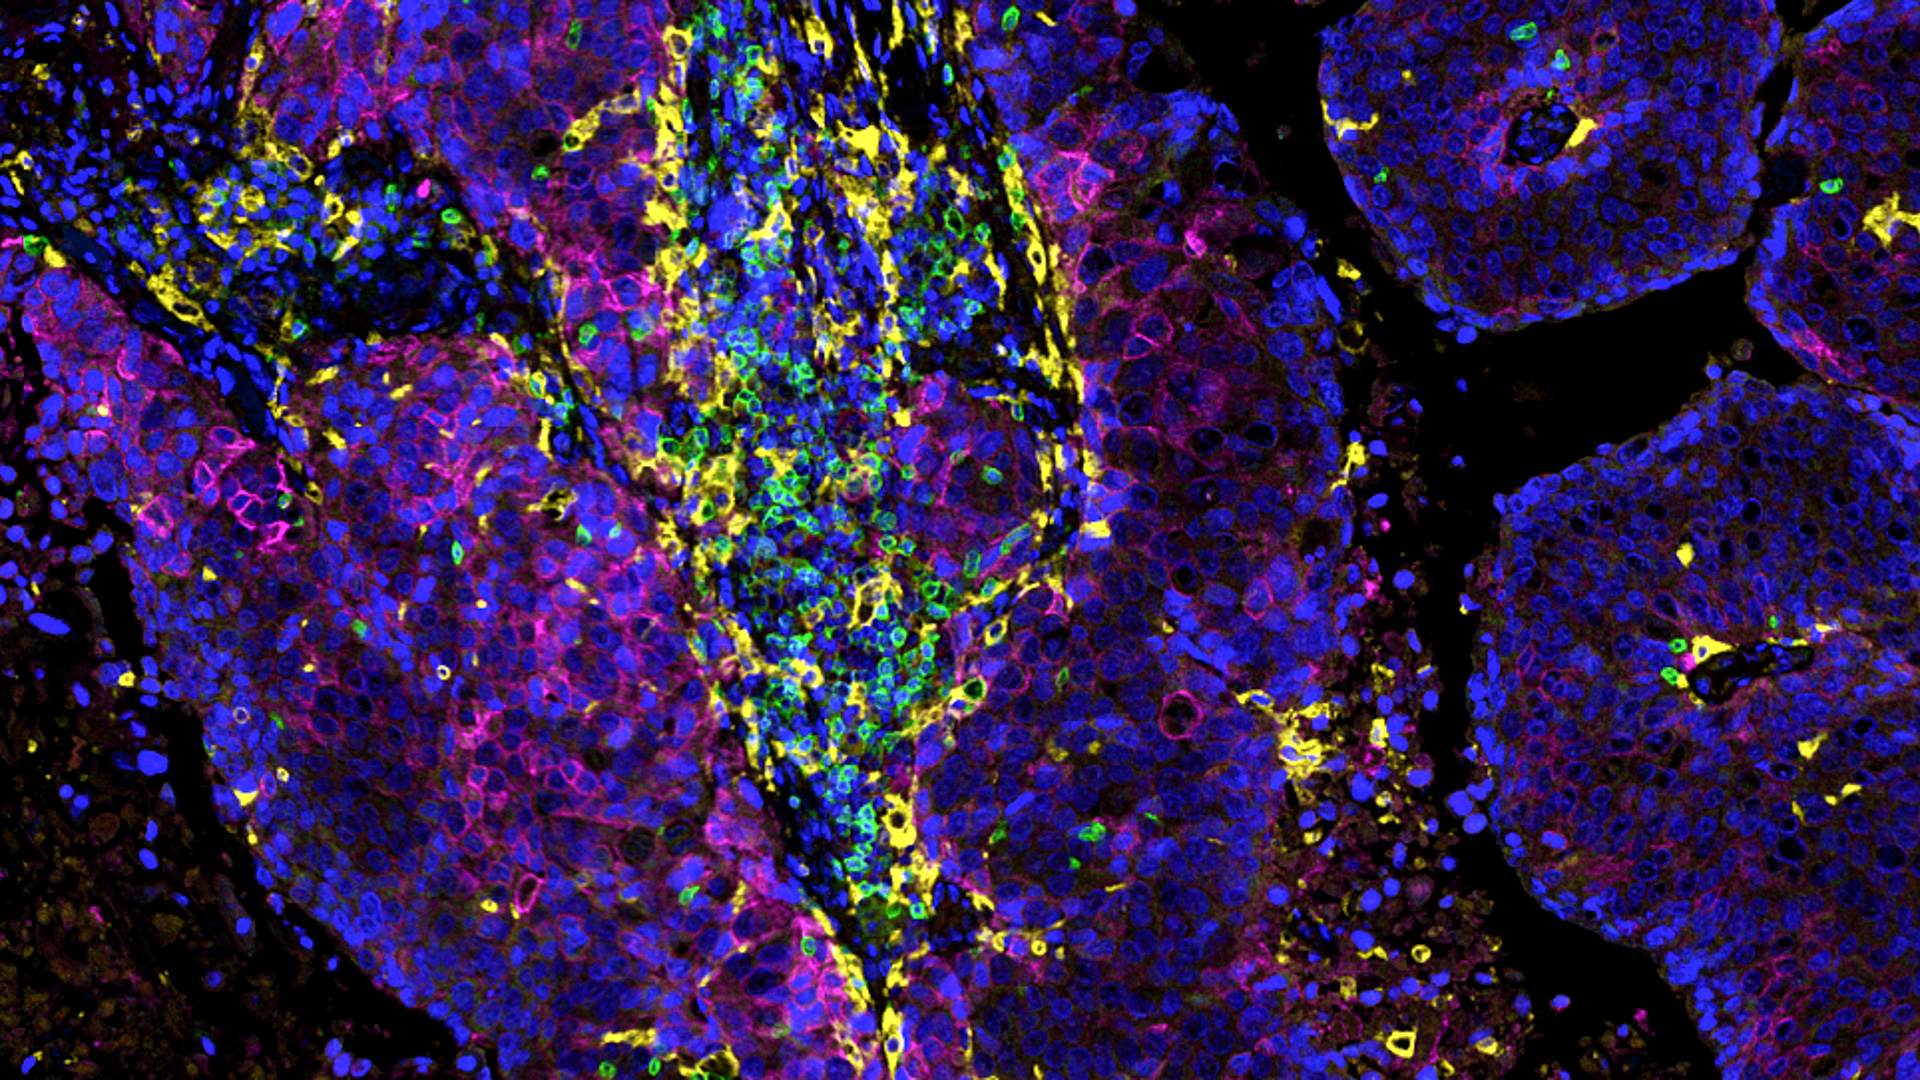
- A wide range of markers: we apply a range of validated markers, either as single markers or within multiplexed approaches.
- Customization: to align with the sponsor’s project and hypothesis, we develop custom markers and panels
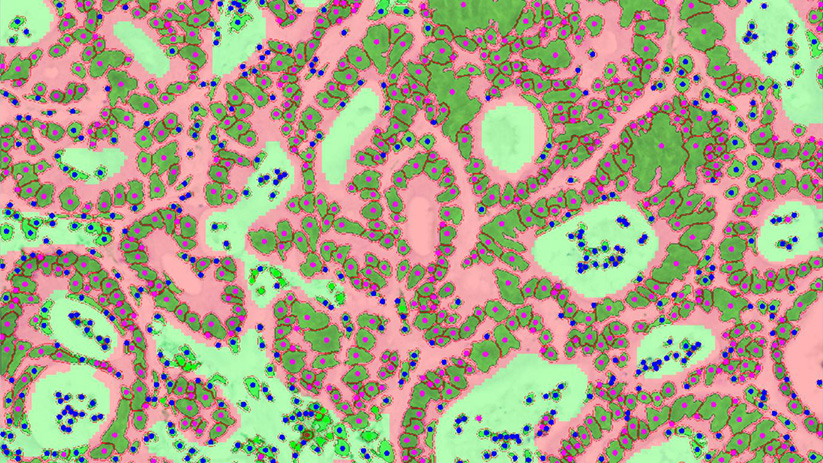
Versatile Technology Platforms & In-House Bioinformatics Capabilities
- Appropriate platform selection: we select the analytical platform based on the nature of the sample and the marker of interest.
- Advanced technologies: our analytical platforms include single-cell and spatial transcriptomics, digital pathology, proteomics, metabolomics, and more.
- In-house data analysis pipeline to compile robust and insightful data sets
Experts
in Immuno-Oncology
- >10 years of experience in the assessment of tumor and immune markers
- Specific expertise in tumor immune infiltrates and tertiary lymphoid structures (TLS)
- 30+ peer-reviewed publications in key immuno-oncology journals
Personalized
approach
- Scientific interactions to define the most relevant strategy based on available samples and scientific goals
- Wide range of validated panels, and developments of custom markers
- A dedicated study director (PhD) from experimental plan to final report discussion
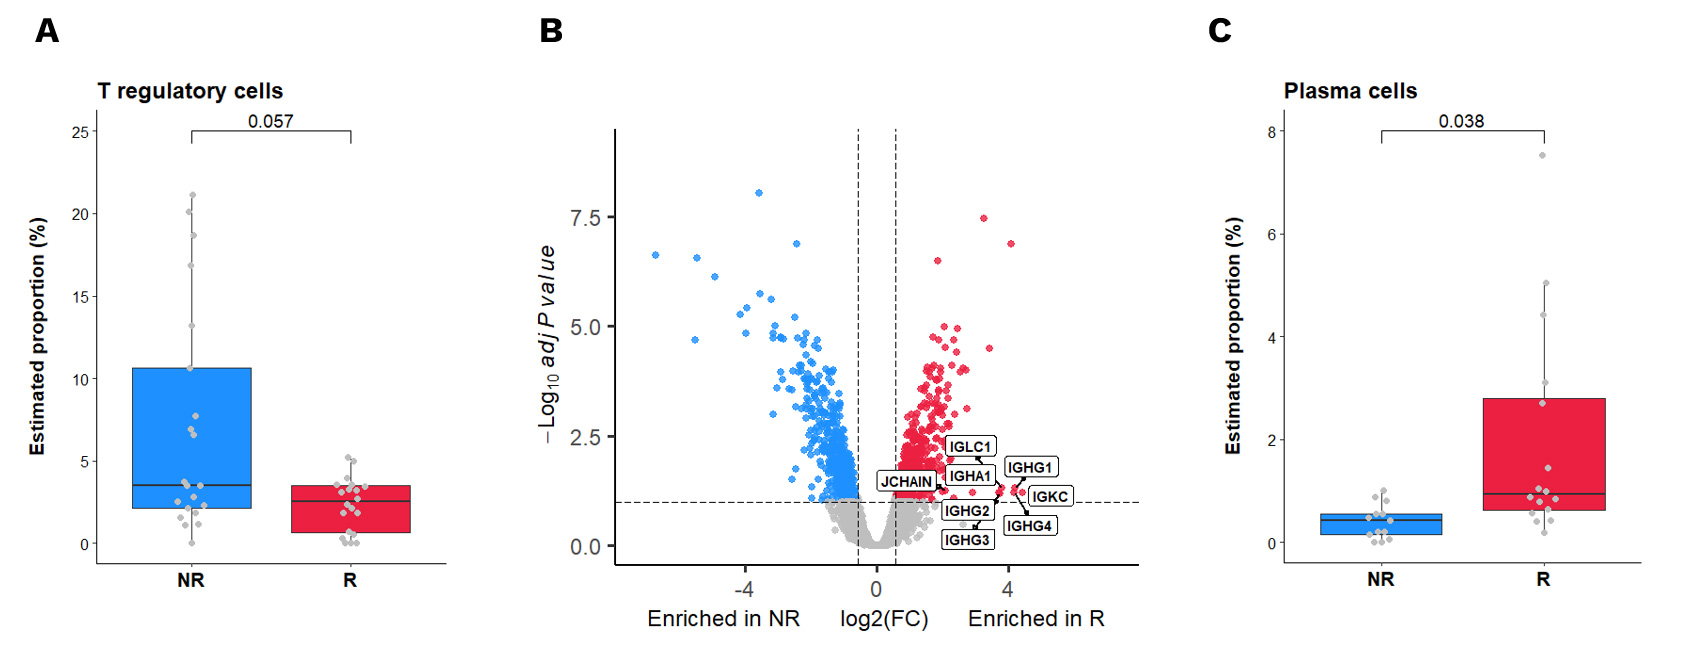
In this groundbreaking study supervised by Antoine Italiano from the Bergonié Comprehensive Cancer Center, we utilized advanced spatial transcriptomics to explore the determinants of response to PD1 inhibition in TLS-positive sarcomas. This research identified specific immune cell subsets – regulatory T cells (Tregs) and plasma cells – associated with therapeutic response.
(A) Estimation by SpatialDecon deconvolution analysis of GeoMx data of the percentage of Tregs in the TLS of anti-PD1 responders (R – n=20 AOIs) and non-responders (NR – n=21 AOIs). Adjusted p-value was calculated using Wilcoxon test with BH correction. (B) Volcano plot representation of the gene differentially expressed between anti-PD1 responders (red) and non-responders (blue) in their tumor areas. Dashed lines for FDR <10% and Fold Change >1.5 are depicted. (C) Estimation by SpatialDecon deconvolution analysis of GeoMx data of the percentage of plasma cells in the stroma of anti-PD1 responders (R – n=16 AOIs) and non-responders (NR – n=13 AOIs). Adjusted p-value was calculated using Wilcoxon test with BH correction.
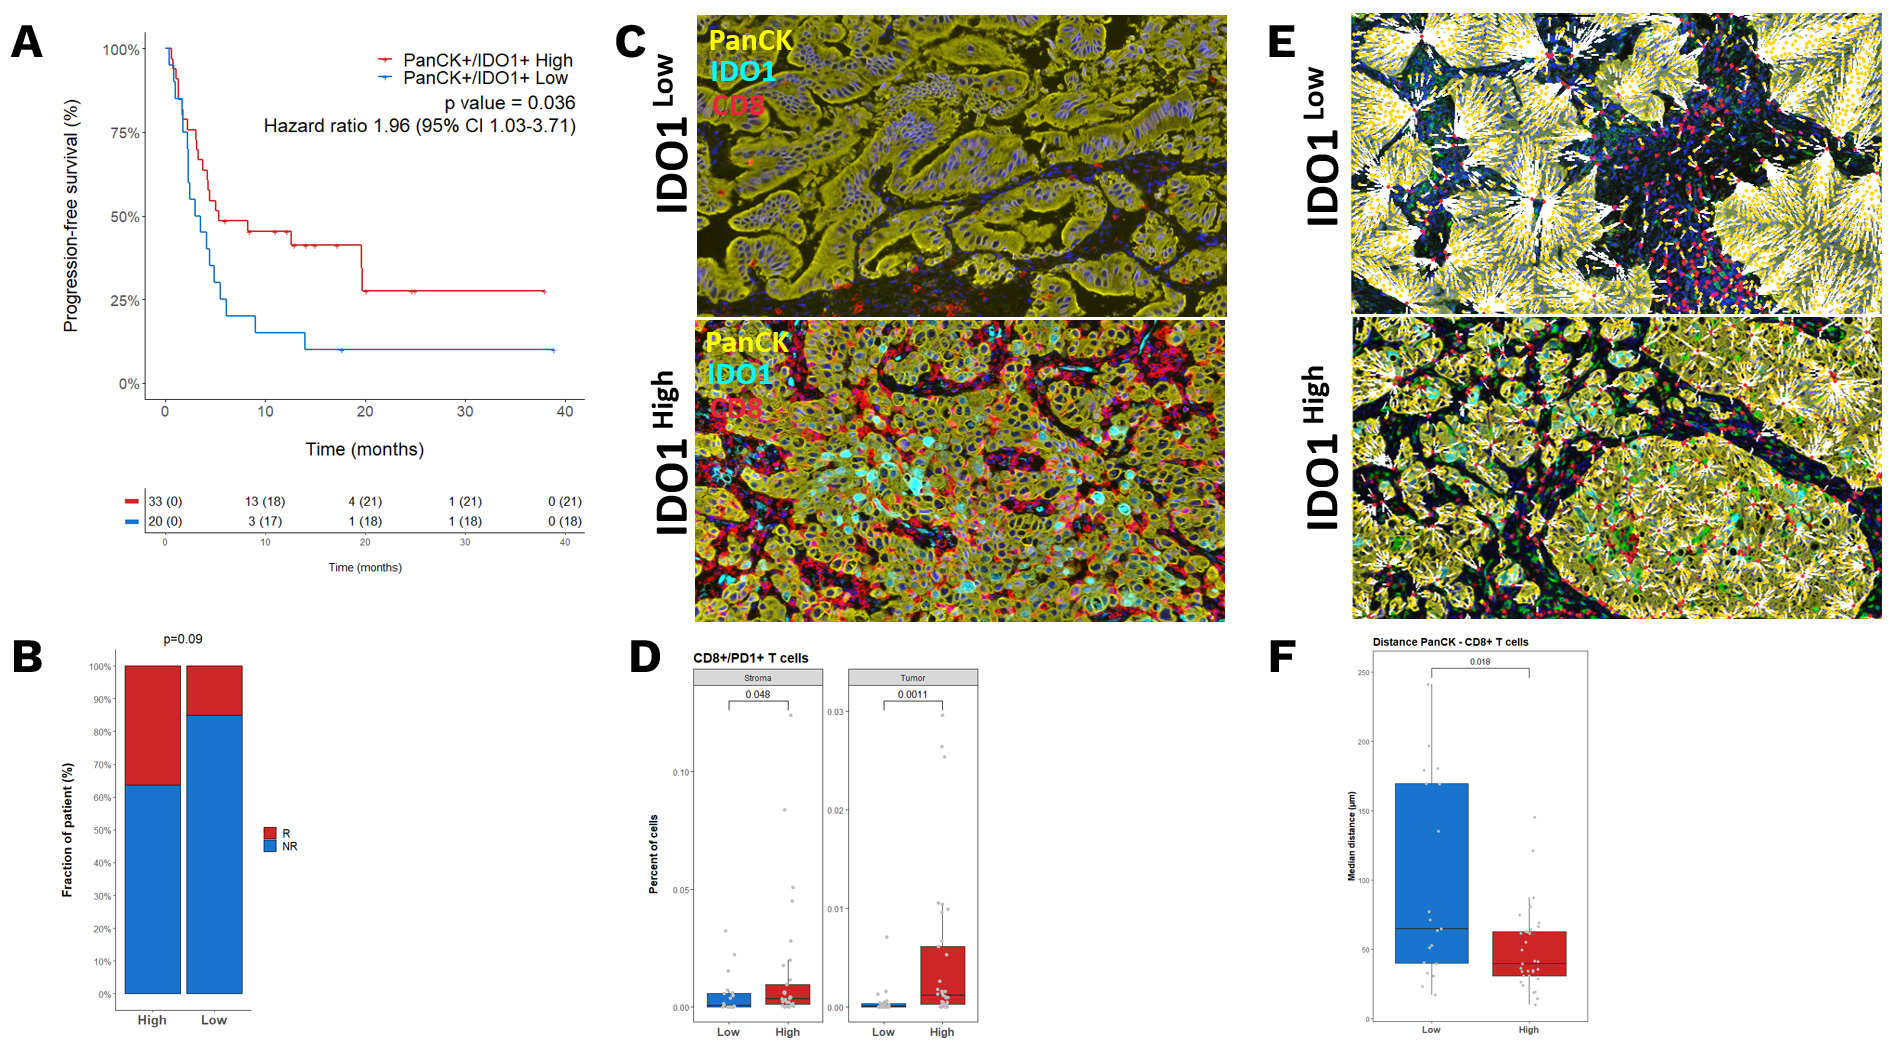
Explicyte, in collaboration with the Institut Bergonié Comprehensive Cancer Center, investigated the role of IDO1 expression in the outcome of non-small cell lung cancer (NSCLC) patients treated with immunotherapy. The study highlighted that the highest IDO1 expression was found within inflamed tumors, which was associated with a favorable response to immune checkpoint blockade (ICB).
Immuno-HistoFluorescence (IHF) Tumor analysis
A Kaplan–Meier curves representing the PFS of patients classified according to their level of PanCK+/IDO1+ B. Proportion of patients who experienced a PFS ≥ 12 months (R) according to their tumor expression of IDO1. C. Representative illustrations of CD8+ T cell infiltration D. Boxplot representation of CD8+/PD1+ percentage in the stroma and tumor of IDO1 High and Low patients. E. Representative illustrations of the nearest neighbor interaction between PanCK+ and CD8+ T cells F. Boxplot representation of mean distance between PanCK+ and CD8+ T cells in IDO1 High and Low patients. P values were calculated by Wilcoxon assay.
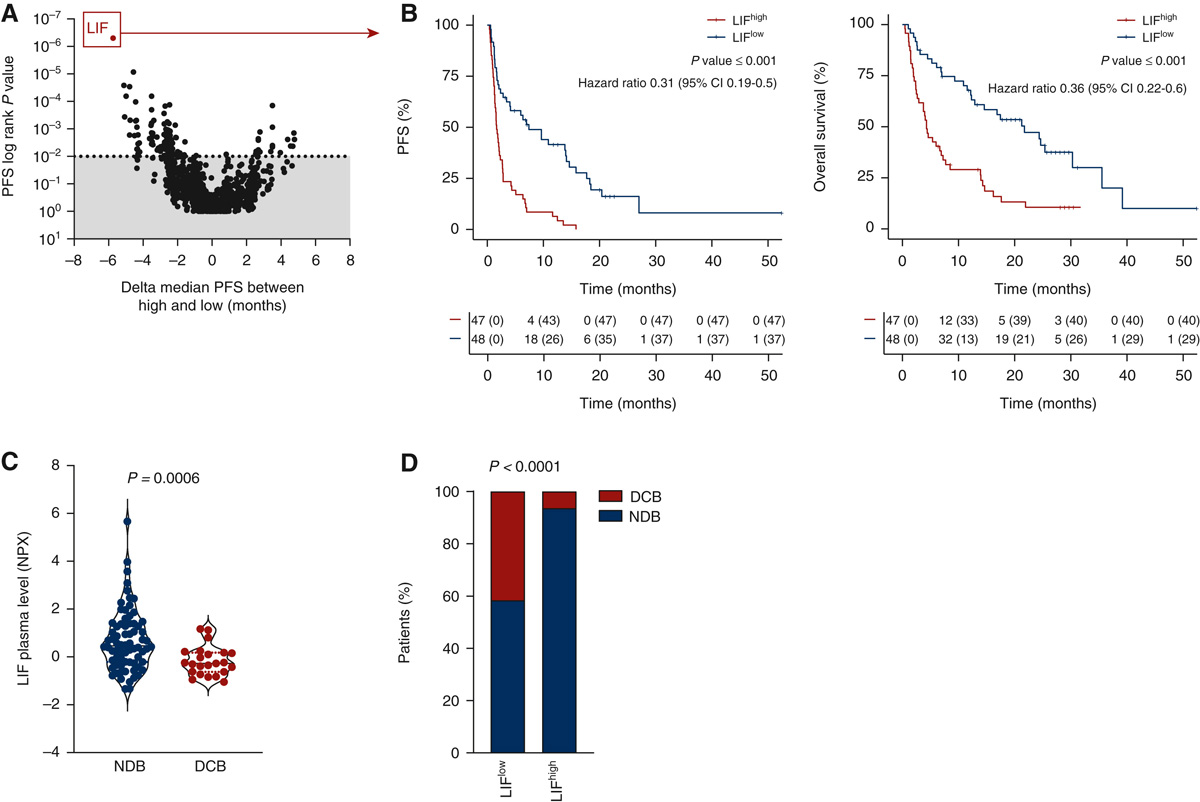
Explicyte, in collaboration with the Gustave Roussy and Institut Bergonié Comprehensive Cancer Centers, analyzed the proteome of plasma samples, collected before treatment onset, from two independent prospective cohorts of cancer patients treated with immune checkpoint inhibitors (discovery cohort n = 95, validation cohort n = 292). The study identifies LIF as a robust biomarker associated with resistance to immunotherapy.
Unbiased proteomic analysis identified that baseline serum levels of LIF are associated with poor clinical outcome in cancer patients treated with immune-checkpoint blockers
(A) Display of the logrank P-values for progression-free survival (PFS) (y axis) and of the delta median PFS (x axis) associated with each plasmatic marker. Median value of each plasmatic marker was used to categorize patients with high or low status. Each dot represents one marker. (B) Kaplan-Meier curves of PFS (left) and overall survival (right) according to baseline plasmatic LIF levels. (C) Quantification of baseline plasmatic LIF in patients with non durable benefit (NDB, n = 72) and durable clinical benefit (DCB, n = 23) patients. P value was calculated using Wilcoxon Rank sum test. (D) Proportion of patients who experienced DCB or NCB according to their baseline plasmatic level of LIF classified as high (above median value) and low (below median value).
Your contacts

Talk to our team !
Paul Marteau, PharmD (preclinical study director), Imane Nafia, PhD (CSO), Loïc Cerf, MSc (COO), Alban Bessede, PhD (founder, CEO), Jean-Philippe Guégan, PhD (CTO)
Tell us about your project !
Biomarker Discovery & Testing for Immuno-Oncology I CRO Services I Cancer Immunotherapy
Explicyte Immuno-Oncology is a translational CRO specialized in the discovery and testing of biomarkers to predict the efficacy of cancer immunotherapies. Our biomarker services in immuno-oncology are based on an in-house platform for automated and multiplexed analysis of tumor micro-environment and peripheral markers, with specific expertise in circulating biomarkers and Tertiary Lymphoid Structures (TLS) in the context of immune checkpoint inhibition.

