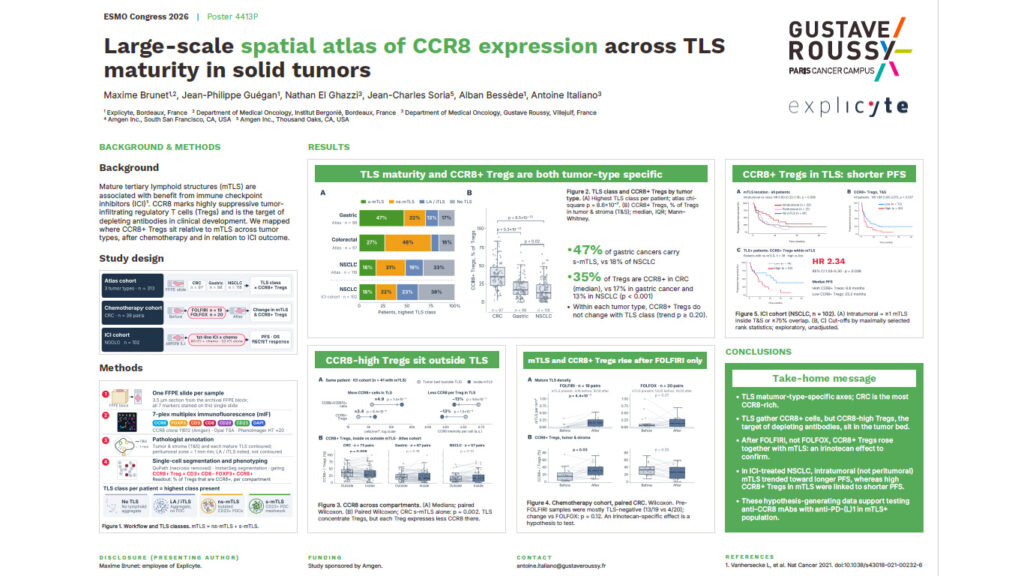
CCR8 Tregs are the highly suppressive regulatory T cells targeted by the depleting anti-CCR8 antibodies now in clinical development. Mature tertiary lymphoid structures (mTLS) are immune hubs linked to benefit from immune checkpoint inhibitors (ICI). Little is known about where one sits relative to the other. In this ESMO Congress 2026 poster (4413P), Explicyte, Gustave Roussy and Amgen present a large-scale spatial atlas of CCR8 expression across TLS maturity in 313 solid tumors. The atlas is complemented by two clinical cohorts: one sampled before and after chemotherapy, and one treated with ICI.
Study design
All analyses ran on a single FFPE slide per sample. Each 3.5 µm section was stained with a 7-plex multiplex immunofluorescence panel: CCR8 (clone 11B12, Amgen), FOXP3, CD3, CD8, CD20, CD23 and DAPI. Staining used Opal TSA chemistry, and slides were imaged on a PhenoImager HT at ×20. A pathologist annotated the tumor and stroma, every mature TLS, and a 1 mm peritumoral rim. Single-cell segmentation (InstanSeg in QuPath) and phenotyping defined CCR8+ Tregs as CD3+ CD8− FOXP3+ CCR8+ cells. Each patient was then classified by the highest TLS class present: no TLS, lymphoid aggregate, mTLS with isolated CD23+ follicular dendritic cells, or mTLS with a CD23+ FDC meshwork.
- Atlas cohort: 313 patients with colorectal cancer (n = 97), gastric cancer (n = 98) or non-small cell lung cancer (NSCLC, n = 118).
- Chemotherapy cohort: 39 paired colorectal cancer samples taken before and after FOLFIRI (n = 19) or FOLFOX (n = 20).
- ICI cohort: 102 patients with NSCLC treated with first-line anti-PD-(L)1 therapy, either with chemotherapy (n = 80) or alone (n = 22), with PFS, OS and RECIST response available.
Key findings on CCR8 Tregs and TLS
TLS maturity and CCR8 Tregs are both tumor-type specific
47% of gastric cancers carried the most mature TLS class, compared with 18% of NSCLC. The median share of Tregs expressing CCR8 was 35% in colorectal cancer, 17% in gastric cancer and 13% in NSCLC (p < 0.001). Within each tumor type, CCR8+ Tregs did not vary with TLS class (trend p ≥ 0.20). TLS maturity and CCR8 therefore behave as two independent axes.
CCR8-high Tregs sit outside TLS
TLS concentrate CCR8+ cells: the density of CCR8+ FOXP3+ cells was about 4.9-fold higher inside TLS than in the tumor bed. However, each Treg expressed roughly 13% less CCR8 inside TLS. The CCR8-high Tregs that depleting antibodies are designed to eliminate therefore reside in the tumor bed rather than in the lymphoid structures.
mTLS and CCR8 Tregs rise after FOLFIRI, not FOLFOX
In paired colorectal cancer samples, FOLFIRI was followed by an increase in mTLS density (p = 4.4 × 10⁻⁵). CCR8+ Tregs in the tumor and stroma rose at the same time (p = 0.03). FOLFOX produced no significant change. Most pre-FOLFIRI samples were TLS-negative, and the difference from FOLFOX did not reach significance (p = 0.12). An irinotecan-specific effect therefore remains a hypothesis to test.
In ICI-treated NSCLC, CCR8 Tregs within mTLS track with shorter PFS
Intratumoral mTLS, but not peritumoral mTLS, trended toward longer progression-free survival (HR 0.60, 95% CI 0.32–1.10, p = 0.086). Among the 38 patients with mTLS, those with high levels of CCR8+ Tregs within their mTLS had shorter PFS: HR 2.34 (95% CI 1.03–5.30, p = 0.038), with a median of 8.6 vs 23.2 months. Cut-offs were set by maximally selected rank statistics, and the analysis is exploratory and unadjusted.
What this means for anti-CCR8 development
These hypothesis-generating data support testing anti-CCR8 depleting antibodies in combination with anti-PD-(L)1 in patients whose tumors contain mTLS. They also show that a bulk Treg count is not enough for this question. Patient selection and pharmacodynamic readouts for CCR8-targeted therapies need spatial context: which compartment the cells occupy, how mature the neighboring TLS are, and how much CCR8 each cell expresses.
How Explicyte generated the data
The study combined several Explicyte capabilities:
- A custom 7-plex multiplex immunofluorescence panel built around the sponsor’s own antibody clone
- Pathologist-validated TLS scoring
- Single-cell spatial phenotyping
- Survival modelling, all from one FFPE slide per patient
The same workflow applies to archival and on-treatment biopsies from your own clinical trials. Download the full poster below, or talk to our team about spatial biomarker analysis for your program.