
Want to benefit from our GeoMx DSP platform services? It's time!
01 / 13 / 2022

Digital Spatial Profiling Case Study
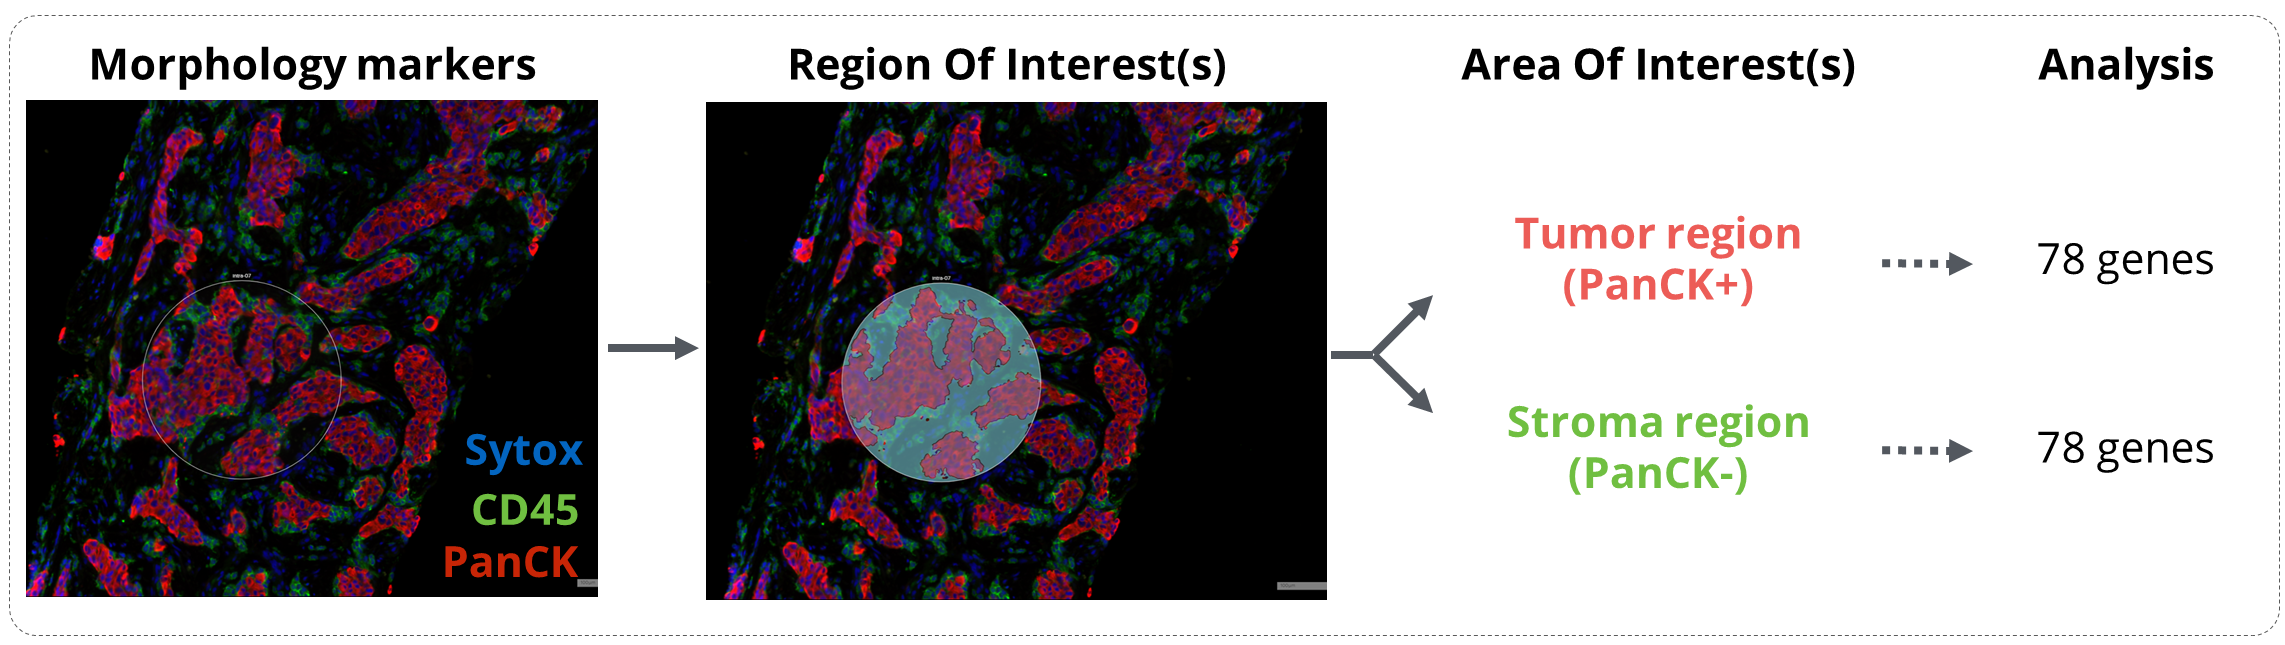
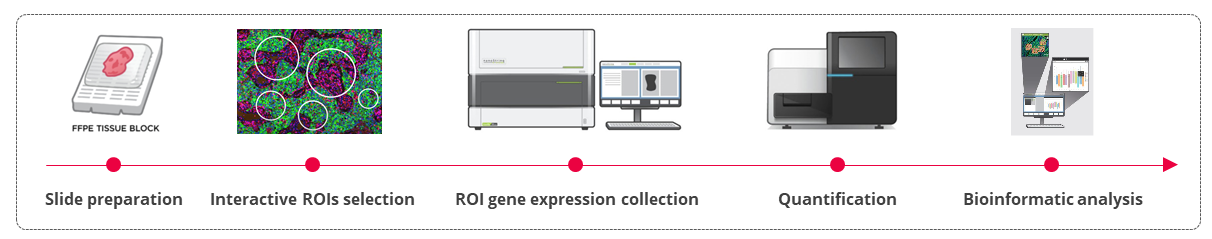
Figure 1. GeoMx workflow analysis. Tissues were incubated with the GeoMx® Immune Pathways Panel probes and stained with the morphology markers CD45 and PanCytokeratin (PanCK). Regions of interest were drawn in mixed tumor/stroma areas and were then segmented in Tumor (PanCK) and Stroma (PanCK-) compartments. Expression of 78 protein-coding genes related to tumor microenvironment profiling were finally analyzed on the Nanostring nCounter platform.
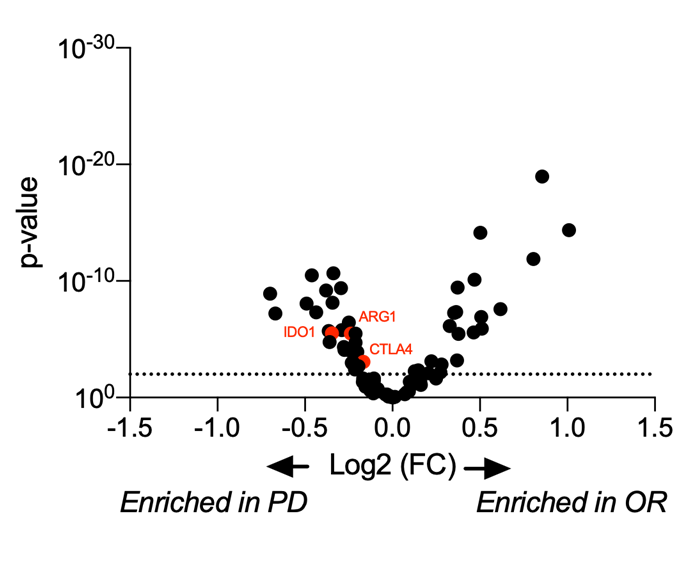
Unsupervised data clustering evidenced a strong stratification of responder and non-responder patients with data collected from the stroma compartment. Using this dataset, we performed a differential gene expression analysis between responders and patients with a progressive disease (PD). This analysis allowed to reveal key determinants of response to ICB in NSCLC patients whose some genes involved in immune escape, e.g. Ctla4, Arg1, Ido1, were enriched in PD patients.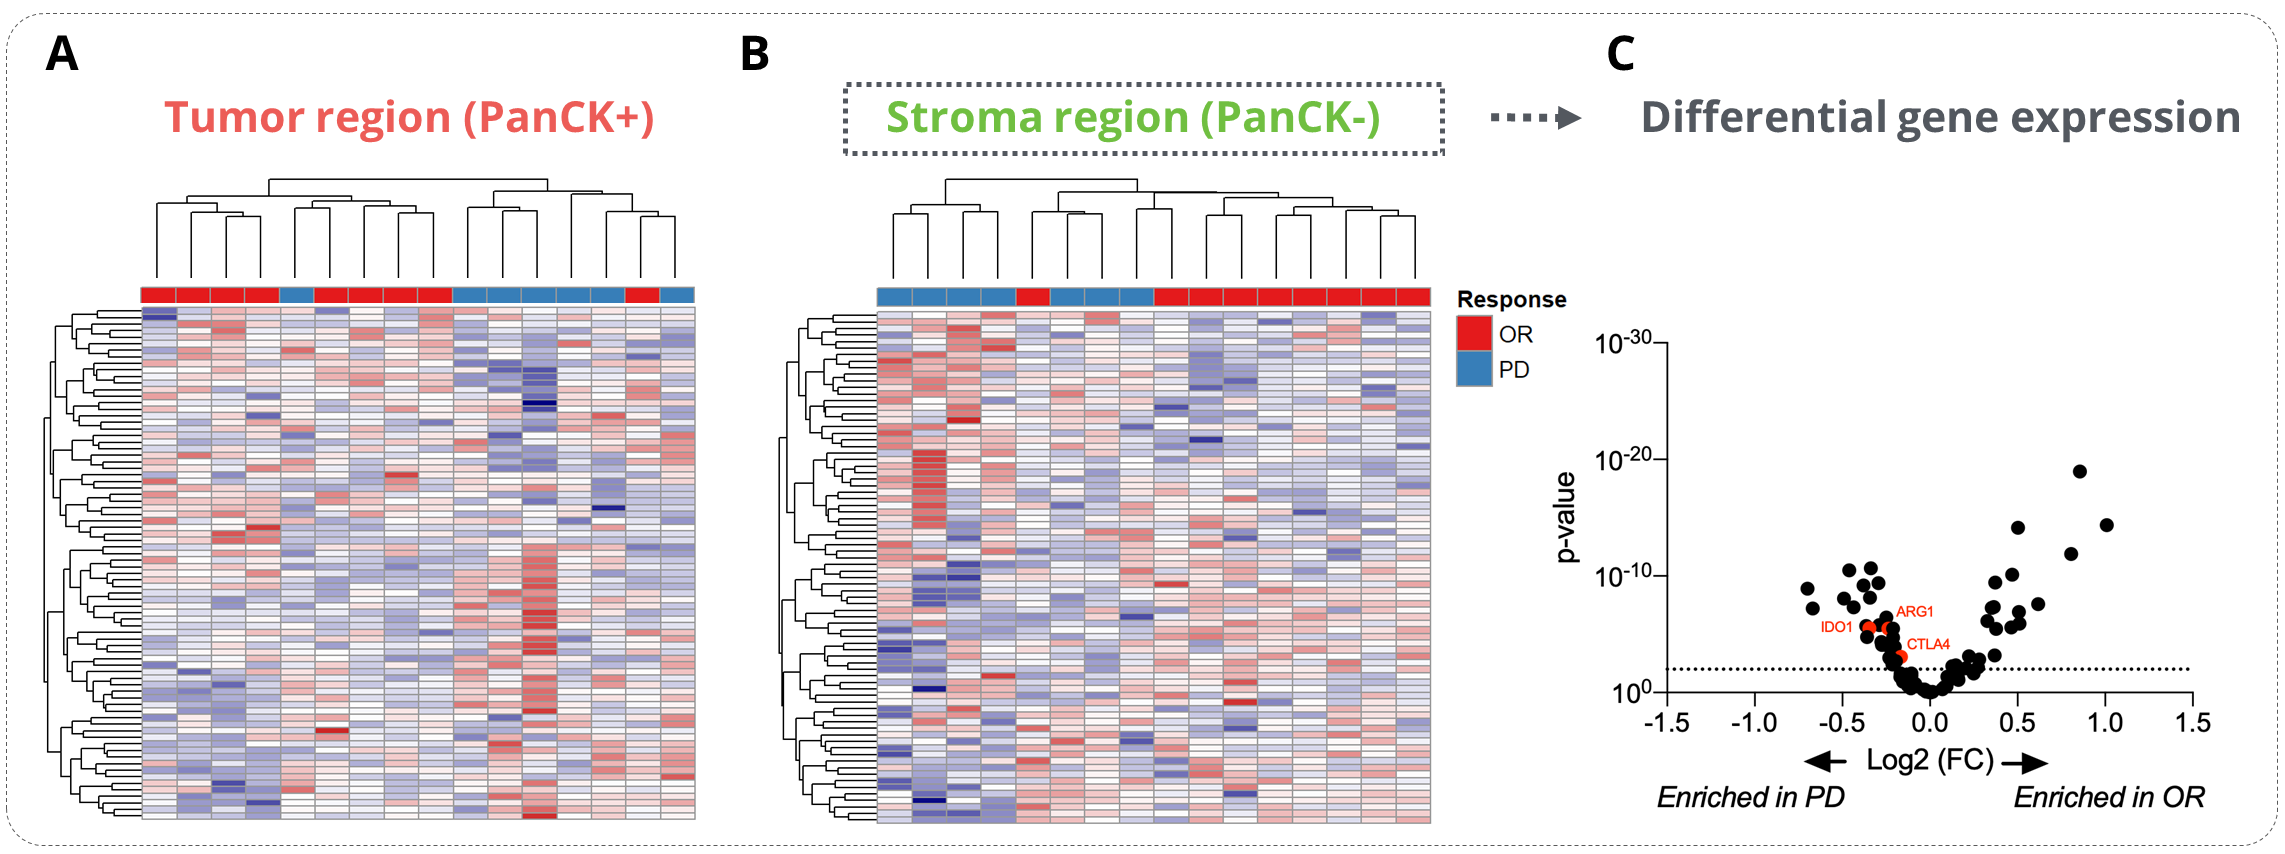
Figure 2. Analysis of the determinants of the ICI response. Sixteen tumor samples from NSCLC patients (8 responders - OR and 8 non-responders - PD) were analyzed on the GeoMx® DSP using the GeoMx® Immune pathways panel (11-12 ROIs per patients). (A-B) Heatmap representations of the tumor (A) and stroma (B) specific gene expression. (C) Differential gene expression analysis of the stroma-specific gene expression from responders and non-responders patients . OR stands for Objective Response and PD for Progressive Disease.
